If you’ve shot a digital camera in your life, you’ve probably seen something that looks like this:

Many of you probably know about our friend the histogram, and that’s great. This post is mostly for those of you who are baffled by this graph. Today I’m going to give you a simplified explanation of what the histogram is, and why you should be using it every time you shoot.
The good news is, it’s way simpler than you think, not some super technical detail that requires an engineering degree to decipher. It’s just a graph that shows you how many pixels fall on each brightness value. Still sound complicated? Think of it this way: the X axis on this graph is brightness, on a scale of 0 to 255. The leftmost side of the graph represents pure black pixels, where brightness = 0. The far right side of the graph represents pure white pixels, where brightness = 255. Every value that isn’t on the extreme left or extreme right side of the graph is somewhere in between pure black and pure white.
The y axis of the graph is how many pixels landed on each value between 0 and 255.
So if you have a picture of a plain gray concrete wall, you have a whole bunch of pixels that are basically in the middle between pure black and pure white.

If you take a photo with your lens cap on, you’ll get a photo that has more or less all of its pixels as pure black. The opposite is true for taking a 30 second exposure of the sun at noon (important safety note: do not do this, as your lens can and will literally focus enough sunlight onto your sensor to melt it)

Notice how about 99% of the pixels in this lens cap image are on the far left, where brightness = 0

No sensors were harmed in the making of this photo.
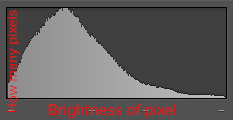
Of course, the vast majority of photos we take have a much wider variety of pixel brightnesses, so you most commonly see histograms that look more like this:

Insert “50 Shades of Gray” joke here.
Okay cool, so we have a graph of our pixels. Why do we care? Well, basically for three reasons:
Your LCD lies to you. Tell me if this sounds familiar: you take a picture, look at the picture on your camera’s LCD screen, and say, “Yeah, looks good. Not too dark, not too bright.” And then you get home and put it on your computer, and suddenly it’s obvious that it was super underexposed, even though it looked great on your camera’s screen. You feel betrayed, and look over at your camera. Et tu, Fuji? But your new friend the histogram is an honest Abe. He’ll never lie to you, because the brightness of your camera screen doesn’t change the number of pixels at each brightness level in the image itself. You can count on him every time.
You can have instant feedback at a glance on how your exposure came out. Got a nice mountain of pixels right in the middle of the graph, tapering off towards the sides? Cool, you have a good exposure. See a lot of pixels stacked over on the right side with very little going on towards the left? You might be overexposed. Maybe you were trying to overexpose, and that’s cool, but at least you know now. Got a lot of pixels pushed up against the left? There’s a ton of black in your photo. If you weren’t trying to get a ton of black in your photo, now would be a good time to drop your shutter speed or raise your ISO and shoot it again.
You also get instant feedback about contrast. Plenty of pixels in the middle area of your photo without very much toward the left or right sides? That’s the hallmark of a low contrast image (which I stress, isn’t necessarily bad, just something you probably want to know). If your histogram looks like a giant U with very little going on in the midtones but a ton stacked up against both sides, then the scene you just photographed has more contrast than your camera can handle in a single frame. Think about bracketing. This happens a lot in landscape photography, especially around sunset when a lot of us like to shoot. It’s very common for the sun and warm skies in a photo to come out looking blown out while the foreground and non-sky parts come out really dark. Bracketing can solve that.
In short, your histogram can tell you immediately after taking a photo if you need to take it again, or bracket, and it can do so with 100% reliability. I have heard arguments that “chimping” (looking at the back of your LCD after taking a photo) is a bad habit. And I suppose that makes sense if you’re an NFL photographer and can’t afford to miss any of the action. But I’m a nature photographer, and full disclosure, I take the 1.3 seconds to check the histogram of virtually every photo I shoot.
So let’s talk about bracketing. I’m a visual learner, so I’ve put together a few graphics that I’m hoping will help you visualize what happens when you bracket.
Your histogram tells you how many pixels fall on each of 256 brightness values between 0 and 255. Unfortunately however, the real world doesn’t conveniently package all possible levels of visual brightness into 256 buckets for you. Let’s take a look at a scene with tricky lighting and a ton of contrast. If I wanted to grab a super precise light meter and take a gigantic grid of readings that covered the whole scene and then graph that, it might look something like this:

Here’s the problem. My camera’s dynamic range only goes from 0 to 255, but as you can see, the “real life” graph of all the brightness values is more like 0 to 1000. So I can set my exposure to capture the super bright parts of the image really well, and I’ll capture this 256-sized chunk of that brightness range:

That gives me this histogram with my photo:

The leaves looks bright but not pure white, the bits of sky showing through are blue and light gray instead of pure white, and that’s great. But what about darker areas? Well, they’re black. As you can see from the histogram, we have a ton of super dark and even black pixels in our photo. That was the compromise we had to make to get the super bright parts of the photo to be exposed correctly instead of pure white. Even though our “real life” graph of all the brightnesses in the scene has a lot of different values over to the left of the part we captured in our photo, the camera can’t see that at the same time as it sees the detail in the bright parts, so anything that’s not in the “green zone” of the exposure we picked… comes out black.
We have some options here. We can accept the pure black. I often shoot silhouetted objects against a sunset on purpose, and I want them to be pure black. If that’s the case, no problem. But let’s assume we really are trying to get detail and tone in the whole scene, not just the brightest leaves here. We can expose to get the tree trunk correct instead of black of course, but that doesn’t solve the problem, it just moves it. As you can see below, we’re capturing a darker chunk of the actual brightness values and letting the brighter ones to go pure white.


This is arguably a better image, but the grass in the foreground in particular looks awful to me, and there is tons of white where we don’t necessarily want it. If we tried to split the difference and find a middle ground exposure to get everything, we would actually end up with the worst of both worlds - a few parts of the image exposed correctly, and tons of detail lost to both pure white and pure black on the sides of the histogram. This is the dreaded “U-shaped” histogram, which tells you that the scene is too contrasty to capture in a single exposure. We need to bracket exposures. Bracketing is literally just shooting the same photo at different exposures to make sure we have adequately captured the full brightness range of the scene. We can later combine these exposures into a single image, and have the best parts of every shot blended together how we want them.

Most cameras have some sort of Auto Exposure Bracketing (AEB) that will automatically click off three or more frames in a row for you at different exposures. But if yours doesn’t, there’s no reason you can’t simply do it manually. Take a photo that captures the darkest parts of the scene in enough detail for you to be happy, then shoot it a stop darker, another stop darker, and so on until you no longer see any pure white pixels in your histogram. Obviously having an absolute minimum of camera movement in between exposures is important, so if you have a tripod and a cable release, you should be using them right about now. If you don’t, try your best to brace your camera or yourself against a solid support and hold as still as possible between frames. The software that will later merge these exposures into a single photo can sometimes help align small differences between frames.
Once you have all the frames that capture the full brightness range of the scene, you can use Lightroom, Photoshop, or your editor of choice to merge them into a single High Dynamic Range (HDR) photo. As with stitching panoramas together, it’s often best to do white balance edits to your individual frames before merging them (make sure you do the same edits to every photo), since sometimes merging them causes you to lose some of your data. The computer takes all of the brightness data scattered across all the frames you gave it, and basically squishes them closer together so they all fit into a range between pure black and pure white.
Now you can edit your photo per usual, just notice that your exposure/brightness sliders give you a lot more flexibility than usual. Here’s my final product compared to the “single frame” versions I captured before. As you can see, bracketing has allowed me to simultaneously capture detail in both shadowy tree trunks, and the much brighter backlit leaves. In my final edit, I chose to make some of the canopy and sky pure white as an artistic decision to emphasize the warmth and glowing feel of the scene, but if I wanted to, I could easily have recovered that highlight detail.

A couple of last points - camera manufacturers have long since figured out that Dynamic Range (or the width of the brightness graph your camera can capture in one frame) is a great marketing term. And getting a more expensive camera body will get you more dynamic range for sure. But even ancient cameras can bracket as much as you need to capture high contrast scenes. The example photo I used in this post was taken on my S100, a tiny compact camera that was released in 2011. It’s so easy to do in post processing at this point that I no longer even worry about the camera’s dynamic range when looking at specs. The difference between needing to bracket 5 shots and needing to bracket 3 shots to capture a high contrast scene means nothing to me in terms of how long it takes to edit a photo or what the final result looks like. If you hate exposure bracketing and want to do everything with a single shot as much as possible, then high dynamic range should be a priority for you when shopping for your next camera body. Otherwise, don’t sweat it.
Finally, a lot of newer cameras and even smartphone cameras now have automatic HDR features built into them. I wouldn’t use them for serious work, personally. Like any other automatic function, it’s just guessing at what you’re trying to accomplish; it doesn’t actually know. If you’re trying to make art, I don’t see the point of letting a computer make creative decisions for you instead of making them yourself. My $0.02.
Hopefully this post has helped to demystify histograms, as well as the relationship between actual real-life brightness in a scene and what your camera is capturing. Have questions about bracketing or dynamic range? Leave me a comment and I’ll do my best to answer.